Showing posts with label Science for Kids. Show all posts

Monday, April 13, 2020

Science for Kids: Capillary Action (Rainbow Walking Water)


We are living in an interesting time with COVID-19.   School has switched to e-learning and the kids are home for the rest of the year.   If you are like our family there are good moments and then there are the times the kids are going a little stir crazy!  Well there are lots of cool science experiments out there that can give the kids some entertainment while still learning.

This experiment is in a video format, however be sure to check out the other "Science for Kids" activities I have blogged on in the past.

Link to other activities!


As for the experiment we are going to do today, it is a very simple one to do at home.   It helps explain and show  how water can actually move UP.  A really tall tree still needs water to reach all the way to the top.  How does this work?  Well let's take a look to find out.

Enjoy trying this experiment out!  If you would like to go directly to You Tube just click this link:  Science for Kids: Capillary Action (Water Walking Rainbow) Experiment and Video


Monday, December 16, 2019

Science for Kids: Population Genetics with PTC paper


I love going out and teaching kids about science.  Since moving from North Carolina to Indiana, I have really missed engaging in STEM outreach at local schools.  However a group of us at work decided we would be on the lookout for these opportunities and get into some schools.  Our company Inari has been supportive of our efforts and so we recently found a local middle school, East Tipp that welcomed us to take over an 8th grade science class for a day.

The group  at work has been amazing as we build out our activities and lessons.  The credit for this science module that delves into population genetics goes to Cole Davis.  He put together a great lesson!

Objective:  

The objective of this lesson is to learn more about about population genetics which is the study of gentic variation in populations.  Some of the concepts to tackle include gene frequency, dominant, recessive, homozygous, heterozygous, etc.  The core exercise involves tasting PTC (phenylthiocarbamide) paper and mapping out the class population genetics based on the whether each student can taste the bitter compound (PTC) or or not taste PTC.

Supplies:  


The strips can be found very cheaply on Amazon: PTC Test strip link


Background:


DNA is how all of our genetic identity is stored and thus determines who are are and what we look like.   This DNA encodes for GENES and our genes are ultimately translated into many different  proteins.   Proteins define all the functions in our bodies or in a living organism. 

This figure shows how DNA is transcribed to RNA and RNA is translated into protein.
https://biologywise.com/protein-synthesis-process


The exercise today looks at one particular protein called a PTC taste receptor that is found in on the tongue.  We have lots of taste receptors that allow us to taste salty, sweet, bitter or sour.  Each different receptor is coded by our DNA.   One of those genes found coded in our DNA is for a PTC taste receptor that allows some of us to taste PTC.  If you can taste it tastes very bitter!  


https://learn.genetics.utah.edu/content/basics/ptc/


For around 75% of the population, PTC tastes very bitter!   For the other 25% of the population they do not taste any bitterness (or anything at all) when trying PTC.  

The PTC taste receptor protein found on our tongues looks like this:


Whether you taste PTC or not is determined by just one gene called TAS2R38.    The genes we get are determined by our parents.  For all genes, we all get one copy of a gene from our mom and one copy of a gene from dad.   Our parents DNA is ultimately what determines the makeup of our DNA and so our parents can give us different versions of the PTC gene depending on what they have.   The gene version that forms a protein that can taste PTC is a DOMINANT gene.    If we have just one gene from our parents that is dominant we can taste PTC.  However over time, the DNA code changed and that change means the DNA translated into a slightly different protein.   This changed version of the gene is RECESSIVE.   The new protein that some people have from a recessive version of the gene is not functional, meaning it does not work and the receptor does not taste the PTC.    However since you get a copy of the gene from mom and a copy from dad, you need to have both recessive copies (non-functional) in order to not taste PTC.

PTC gene:

A = Dominant (just one copy can taste PTC)
a = Recessive (takes two copies to NOT taste PTC)

Individuals have 2 copies of the genes:  One from each parent

AA = "Taster" since both copies are Dominant from each parent = Homozygous Dominant
Aa or aA = "Taster" since one parent still gave a dominant version of the gene - Heterozygous
aa = "Non Taster" since both parents gave a recessive version of the gene = Homozygous Recessive


EXERCISES

Exercise 1:   Taste the PTC paper

With the background out of the way, now the fun can begin.  The students can take the PTC paper and taste it.   At this point you see all kinds faces and get all kinds of reactions!

This just tastes like paper.
YUCK!
I don't taste anything
That was disgusting!
I didn't like that!

As long as you have a decent size population, you will have some tasters and non-tasters.   Statically 1 in every 4 people do NOT taste.  However, smaller populations can have very different frequencies.  Once everyone tastes you can dig into the genetics of the class.

Exercise 2:   Class Frequencies

The first thing to do is get the frequencies of the class population.  How many tasters in the class?  How many non-tasters?  After determining the class size you can determine the percentage of tasters (AA, Aa, or aA) vs the non-tasters (aa).  Did the class follow the average 75% taster / 25% non taster human population?  If not, why would the class frequency look different?

Exercise 3:   Hardy-Weinberg Equation

When we look at the class population data, we now know with certainty that the non-tasters are aa or homozygous recessive.  However everyone that tasted the PTC could either be AA (homozygous dominant) or Aa / aA heterozygous.   There is a mathematical formula that we can use to predict how many people in the class are AA vs heterozygous.  The formula is called the Hardy-Weinberg Equation and as a class we worked through solving it.  Following steps 1-5 below will solve this equation. 


Here is a resource where the equation is shown with a real example:  http://www.germanna.edu/wp-content/uploads/tutoring/handouts/Hardy-Weinberg-Equilibrium.pdf

Exercise 4:   Random Distribution vs Hardy-Weinberg Equation 

We just predicted the percentage of AA, heterozyous and aa frequencies in our class using the Hardy-Weinberg equation.   Now we tried to simulate natural variation in the population by rolling a dice so that each Taster could assign themselves as AA, Aa or aA.  The non tasters are still aa.

Each taster rolls a dice and based on there rolls they are the following.

1 or 2: aA
3 or 4: Aa
5 or 6: AA

Since each student now has a genetic identity for PTC based on the dice roll if they were tasters,  we re-calculated the frequencies and compared it to the Hardy-Weinberg result.  If there were differences we discussed the reason.  The results was usually much closer when we had a really big class.  In the smaller classes the two results were usually a little different. 


Exercise 5:  Bottlenecks

After working through the population genetics we talked some about bottle necking.   This is when a population is reduced to a smaller group or size and the limited diversity in the that population becomes the new norm.


 I work in agriculture and there has been intentional bottlenecking through artificial selection in some crops.   We talked a little through this concept.  This bottlenecking is one of the reason we have been able to increase yields.  


There are also examples where bottlenecking in agriculture has had consequences.  The potato famine is one example we talked through as a class.  The lack of genetic diversity led to a loss of the potato crop which in turn led to starvation and death.

From:  https://www.britannica.com/event/Great-Famine-Irish-history
The Irish relied on one or two types of potatoes, which meant that there wasn't much genetic variety in the plants (diversity is a factor that usually prevents an entire crop from being destroyed). In 1845 a strain of water mold accidentally arrived from North America and thrived in the unusually cool moist weather that year. It continued to destroy potato crops from 1846 to 1849. 

The PTC paper really helps to bring some fun into the concept of genetics.   There are some worksheets that Cole put together that allow the students to work through these exercises.   The worksheets contain even more details and scenarios depending on how deep you would like to go with this science lesson.

Worksheet:
Population Genetics Worksheet using PTC paper


Thanks to some awesome folks at Inari with huge props to Cole, Katie, Grant, Gretchen, Jess.  And thanks to East Tipp Middle School for inviting us!


Monday, April 23, 2018

Chemistry Fun - How does the antacid Gaviscon work?

Have you ever had heartburn and gone to the medicine cabinet to grab some relief.   Then have you ever stopped and wondered how that medicine is actually working?   Heartburn  is caused when acid from the stomach moves up in the esophagus.  The sphincter muscle controls the opening from the esophagus to the stomach so if this muscle does seal correctly you can feel heartburn.  The stomach is covered in thick mucous and is protected from the acid, but the esophagus does not have that protection.

One way antacid can work is by reducing the acidity of the acid in your stomach.  If the acid is not as strong it will not inflame the esophagus as much.  However the antacid Gaviscon works a completely different way and the chemistry is pretty ingenious.

The main ingredients of Gaviscon are:

Sodium alginate
Sodium bicarbonate
Calcium carbonate.

The chemistry behind Gaviscon is pretty neat. 

Sodium Alginate is a polymer that is derived from seaweed.  Once it goes into the stomach, the acid in our stomach makes it go from a soluble state to an insoluble state.  In other words it becomes a solid.   Secondly there will be Calcium ions in the stomach from the calcium carbonate.   The calcium helps to cross-link the alginate molecules together into something called an "alginate raft."  You are left with a big piece of solid material in your stomach from the medicine.

The second piece of the story is the calcium carbonate and sodium bicarbonate react with the acid in your stomach to form carbon dioxide gas.   The gas that is formed propels the solid alginate raft upwards.  It gets caught at the top of the stomach where the esophagus and stomach come together and forms a barrier.  This barrier prevents acid from going up into the esophagus. 

This is an amazing piece of chemistry and all of it relies on the acid in our stomach to start the reactions.  The neat part is we can replicate the experiment. 


Supplies needed: 

  • 250 ml flask:  This replicates your stomach.  The bottom portion is your stomach and the neck of the flask is your esophagus. 
  • 50 mL Gaviscon liquid
  • 150 mL of 1M Hydrochloric Acid - This can be pretty nasty and most will not have access to this.  So be very careful if you do. (safety glasses, coat, eye protection)


The Experiment

This experiment is quite simple.
1. Add 150 mL of 1M HCl into the flask
2.  Add 50 mL of Gaviscon to the flask
3.  Observe


Watch the Gaviscon go from a liquid to a solid while the alginate raft forms. Observe Carbon dioxide bubbles forming.  And finally watch the gas push the raft up to the neck of the flask and form a barrier.


The barrier actually makes it difficult to get the HCl out of the flask when we cleaned up!!


You just saw a real life application of chemistry in a over the counter medicine thousands of people use everyday.  And it was so fun seeing the students doing the experiment.


Monday, March 5, 2018

Science for Kids: The case of the expanding soap

My son's middle school teacher gets all the credit for bringing this fun science project to my attention.  I highly recommend trying it out.

If you don't want to be spoiled on what happens then just try the experiment first. 

1.  Take a bar of Ivory soap (make sure it is Ivory)
2.  Unwrap the soap and place it on a paper plate
3.  Put the soap and plate in the microwave for a minute and a half (1m:30s)
4.  Observe (but also be careful when taking the plate out as it can be hot)

So....  what did you think? What happened?


Here is the spoiler! The video is not too great due to microwave screen, but the pictures show what happens too.


That's pretty amazing huh!  Be careful the soap does get hot.  Once it cools it will still work like soap so it is an easy way to make soap flakes.

There are some cool conversations that can come out of this experiment. 

The first is about the microwave.  A microwave heats sugar, water, and fats.    So one of those must be pretty abundant in Ivory soap.  The microwave itself has a pretty interesting story which I added below.

The other discussion is about Ivory soap and why it behaves this way in the microwave.   A known fact about Ivory soap is that it floats in water.   Ivory soap is "whipped" to introduce tiny air bubbles.   Those air bubbles contain water and so that is the reason the soap expands so readily in the microwave. 

Below are some fun facts about the microwave and Ivory soap taken from Wikipedia

Ivory Soap

Early days[edit]

In 1840 the J.B. Williams Company in Glastonbury, Connecticut, manufactured soap under the name Ivorine. Williams decided to focus on its shaving soap and sold Ivorine to Procter & Gamble, who later renamed it Ivory.[1]
1874 Procter & Gamble trademarks “Ivory,” the name of its new soap product. The name was created by Harley Procter, the founder’s son, who was inspired by Psalms 45:8 in the Bible: "All thy garments smell of myrrh, and aloes, and cassia, out of the ivory palaces whereby they have made thee glad."[2]
As Ivory is one of P&G's older products (first sold in 1879), P&G is sometimes called "Ivory Towers" and its factory and research center in St. Bernard, Ohio, is named "Ivorydale".[3]
Ivory's first slogan, "It Floats!", was introduced in 1891. The product's other well-known slogan, "​99 44⁄100% Pure" (in use by 1895), was based on the results of an analysis by an independent laboratory that Harley Procter, hired to demonstrate that Ivory was purer than the castile soap then available.[4]
Ivory Soap, 1800s
Ivory bar soap is whipped with air in its production and floats in water. According to an apocryphal story, later discounted by the company, a worker accidentally left the mixing machine on too long and the company chose to sell the "ruined" batch, because the added air did not change the basic ingredients of the soap. When appreciative letters about the new, floating soap inundated the company, P&G ordered the extended mix time as a standard procedure. However, company records indicate that the design of Ivory did not come about by accident. In 2004, over 100 years later, the P&G company archivist Ed Rider found documentation that revealed that chemist James N. Gamble, son of the other founder, had discovered how to make the soap float and noted the result in his writings.[5]

1900's[edit]

In October 1992, Procter & Gamble market-tested a new Ivory formula, a "skin care bar" that would address customer complaints about dryness but would not float like the original.[6] In October 2001, P&G tested the sinking bar soap as part of an advertising campaign in the United States, in a six-month plan to release 1,051 soap bars that sink, among other bars that float, to see if people would notice the sinking bars, even if given a cash reward of up to $250,000.[7] The D. L. Blair company, part of Draft Worldwide, a unit of the Interpublic Group of Companies, was assigned to administer the contest.[7]


Percy Spencer - Inventor of the microwave:

One day while building magnetrons, Spencer was standing in front of an active radar set when he noticed the candy bar he had in his pocket had melted. Spencer was not the first to notice this phenomenon, but he was the first to investigate it. He decided to experiment using food, including popcorn kernels, which became the world’s first microwaved popcorn. In another experiment, an egg was placed in a tea kettle, and the magnetron was placed directly above it. The result was the egg exploding in the face of one of his co-workers, who was looking in the kettle to observe. Spencer then created the first true microwave oven by attaching a high density electromagnetic field generator to an enclosed metal box. The magnetron emitted microwaves into the metal box blocking any escape, allowing for controlled and safe experimentation. He then placed various food items in the box, while observing effects and monitoring temperatures.
Raytheon filed a patent on October 8, 1945 for a microwave cooking oven, eventually named the Radarange. In 1947, the first commercially produced microwave oven was about 6 feet tall, weighed about 750 lbs, and cost about 5,000 US$. In 1967 the first relatively affordable ($495) and reasonably sized (counter-top) microwave oven was available for sale.[2]


Monday, November 13, 2017

Science for Kids: Chromatography and Precipitates

I love when I get a chance to show off science at a school or organization.  When it comes to finding these engaging activities the internet can always be a great source of inspiration.  But as often happens I rely on the awesome people I work with for ideas and activities.    I can't even put into words how working with such inspiring colleagues makes STEM outreach so fun and exciting.

I say all of this because I was invited to go by Davis Drive Middle School in Cary, NC to work with a chemistry club.   I was looking for a new activity since these kids had already seen most of the activities I had in the toolbox.   I was talking to two people I work with and just like that we had two projects ready to go.

Home Chromatography

The first thanks for this activity goes to Marie.   Marie has developed a great exercise to teach chromatography while also introducing some basic practice in pipetting.

The kids received a basic intro into chromatography.


Before the we actually did the chromatography exercise the kids needed to know how to pipette only 3 ul onto the chromatography filter paper.   So we had some food coloring and pipettes for everyone to practice using a pipette.


Here were the pipettes they got to practice with.


In groups they practiced setting the pipettes to the right aliquot setting and pipette food coloring on a practice sheet.  The sheets they were practicing with looked like this:


And the practice in action:


After had pipetting down, we moved on to doing the chromatography exercise.  Each group had blue, yellow, and red food coloring and the then two tubes of a mix of colors (mystery tubes).  There task was to see what colors were in the mystery tubes using chromatography. 

In this exercise, salt water (mobile phase) would move the food coloring up through the filter paper  (stationary phase) and the colors would separate. 

Here the kids got super excited to see the filter papers get added to the salt water.


The results were beautiful!


The summary of all the above exercises are:


Precipitates


After we finished the pipetting activity,  Jun talked about precipitates.  When you mix two chemicals sometimes a precipitate will form.  Jun worked out a simple experiment for the students to try it out.

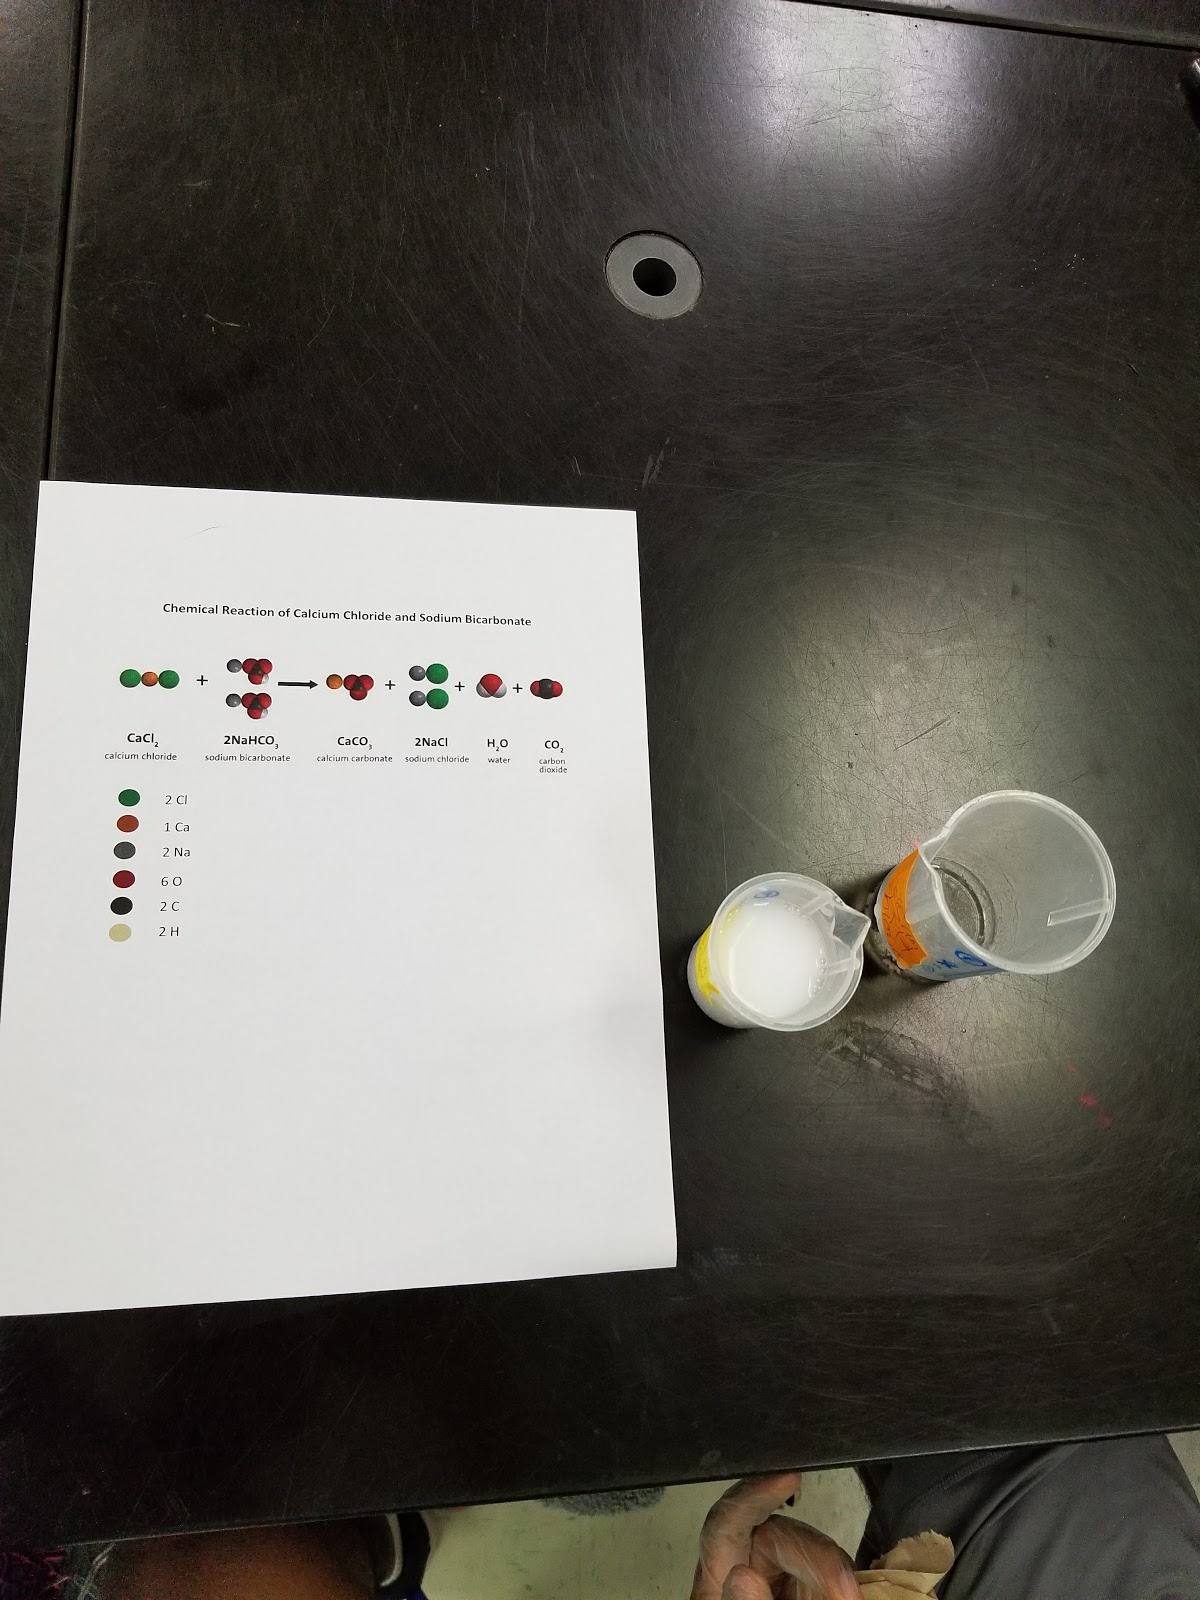
We mixed Calcium Chloride with Baking Soda.  This causes a reaction in which salt, carbon dioxide, and water are formed as well as calcium carbonate.  Calcium carbonate is basically chalk.   So once the mixture was mixed there were bubbles forming which was the carbon dioxide and a lot of white stuff which is the calcium carbonate.


Here is the procedure as well as the reaction.


Thanks Davis Drive for having us!


Monday, March 27, 2017

Science for kids - The Iodine Clock

Some of the best parts of my day are when I get to go to a school or organization and talk about science with kids.  Just the other week I went to Davis Drive Middle School with a colleague (Thanks Mandy!!) to talk about chemistry.   We visited an after school chemistry club and it was obvious these kids were passionate about science and chemistry.

We talked a lot about pH and how it can affect plants.  We also talked about how certain molecules can interfere with other molecules.  This is important in the plant world because certain nutrients can suppress or even increase uptake of other nutrients.  It is important in human health as well.  Many of us have taken medicine and heard from our doctors certain rules we need to apply while on the medicine.  For instance don't eat grapefruit while on this medicine because it can interfere.

So one experiment we did was to try to show how certain components in a solution can interact with other components in a solution.  It is a very visual experiment and done with household supplies.

The supplies you need are Vitamin C (1000 mg), Iodine (2%), Hydrogen Peroxide (3%), and liquid starch.


You will be making two separate solutions.

Solution 1 is a combination of the vitamin C and Iodine tincture in water.

Solution 1 - Step 1.  Mix 1000 mg of vitamin C in 60 mL of water.  The vitamin C we had is 500 mg tablets.  We crushed 2 tablets pretty easily and mixed the powder in water.  We had colored tablets which will work fine.  If you can find non-colored vitamin C that will work just great as well.


Solution 1 - Step 2:  Next add the Iodine to the Vitamin C and water.   You will add 5 mL of the Iodine to the solution.


At this point solution 1 is done!


Next we will make Solution 2 which is a combination of water, hydrogen peroxide, and liquid starch.  

Solution 2 - Step 1:  Add 15 mL of hydrogen peroxide to 60 mL of water.

Solution 2 - Step 2:  Add 5 mL of liquid starch to the water and hydrogen peroxide mixture.

We are now done with solution 2.


Once you have your two solutions, we can start the reaction.


Grab a new clear container and pour solution 1 and 2 together in the new container.  You can pour the new solution back and forth between empty containers a few times to be sure it is well mixed.


At first it will look like nothing is happening.


Over time (hence the clock), the solution will instantaneously turn dark blue-black!!


So what is going on?  Well when starch and iodine molecules mix you get a dark blue.  However we added some other things that interfere with this reaction.

One reaction that is going on is production of I2 molecules.  The hydrogen peroxide was added to the household iodine and it forms Iodine molecules.  When iodine meets starch it turns blue-black.  

+ 2I – (aq) + H2O2(aq) ->I2(aq) + 2H2O(l)

However we did not get a blue-black color immediately. This is because a second reaction was underway due to the addition of the Vitamin C powder.   The I2 produced from the hydrogen peroxide should react with the starch, but instead it immediately reacts with ascorbic acid (from the vitamin C tablets).  This prevents the I2 from reacting from the starch.  In essence it is shielding the I2 from the starch.

I2(aq) + C6H8O6(aq)-> 2H+ (aq) + 2I – (aq) + C6H6O6(aq)


Eventually the ascorbic acid is used up and there will be enough I2 react with the starch and get a color change.  This is a great example of how certain molecules can hinder other molecules.

It was a fun day at Davis Drive middle.   This reaction can be sped up or slowed down by certain variables as well.  We actually split into two groups.  One group used 60 ml of water for solution 1 and 2.  The other group only used 30 ml of water for each solution and we compared which reaction went the fastest.   What do you think?   If you want to experiment or read more at home here is a great resource:  http://www.greeningschools.org/docs/VitaminCClockReaction.pdf


Tuesday, February 28, 2017

Science for Kids: pH fun

I had the pleasure to go to Laurel Park Elementary school in Apex, NC  to have fun with acids and bases and talk about pH.  There are some fun activities you can do with acids and bases and most of these you can do at home too.

Liquid pH indicators - red cabbage juice

There is this great pH indicator that you can make yourself in the kitchen.   You can boil red cabbage or blend it to collect the juice.   I cheated a little and just bought some cabbage extract in powder form from Amazon.  Just add some powder to water and you have red cabbage juice the easy way.


 For this particular brand you add 1 scoop of powder per 100 mL of water.


Depending on the pH of a liquid you add to the cabbage juice, it will turn different colors.


So we took a few different liquids and added them in order to see a color and then use the color to get an estimated pH..


Liquid pH indicator - bromothymol blue

There is another indicator that is really neat.  It is called bromothymol blue.  When you add just a little bit to water it will be blue since the pH is around around 7 or above.  If you take a straw and blow into the solution it will slowly turn yellow.  The reason is that carbon dioxide from your breath reacts with the water and forms carbonic acid.  Pretty neat stuff!


A dab goes a long way!!


Just blow air into the liquid through a straw


pH indicator strips

Lastly we used pH indicator strips to measure pH.  I just bought these from amazon as well.


We paired the kids up and each pair had 5 tubes.  In these tubes were lemon juice, cherry pepsi, water, baking soda, and windex.    They used a strip for each tube to record the color, match the color to a pH and see if they could figure out what the liquid might be.


These activities are a great way to engage kids while you go over acids, bases, and pH.   It's just another way to make science make sense in a fun way.   Seeing kids getting excited while filling out a science worksheet makes for a good day.   I look forward to seeing what the future holds for these future scientists!